OpenTelemetry 跟踪
跟踪提供 Prisma 客户端在操作级别执行的活动的详细日志,包括执行每个查询所需的时间。它可以帮助你分析应用的性能并识别瓶颈。跟踪完全符合 OpenTelemetry,因此你可以将其用作端到端应用跟踪系统的一部分。
¥Tracing provides a detailed log of the activity that Prisma Client carries out, at an operation level, including the time taken to execute each query. It helps you analyze your application's performance and identify bottlenecks. Tracing is fully compliant with OpenTelemetry, so you can use it as part of your end-to-end application tracing system.
跟踪为你提供对 Prisma ORM 项目的高度详细的、操作级别的洞察。
¥Tracing gives you a highly detailed, operation-level insight into your Prisma ORM project.
你可以使用 @prisma/sqlcommenter-trace-context 插件将 traceparent 标头作为注释添加到 SQL 查询中。这使得你可以在监控工具中关联分布式跟踪和数据库查询。
¥You can add the traceparent header to your SQL queries as comments using the @prisma/sqlcommenter-trace-context plugin. This enables correlation between distributed traces and database queries in your monitoring tools.
关于追踪
¥About tracing
当你启用跟踪时,Prisma 客户端会输出以下内容:
¥When you enable tracing, Prisma Client outputs the following:
-
Prisma 客户端执行的每个操作(例如 findMany)都有一个跟踪。
¥One trace for each operation (e.g. findMany) that Prisma Client makes.
-
在每条迹线中,有一个或多个 spans。每个跨度表示操作的一个阶段所花费的时间长度,例如序列化或数据库查询。Span 以树结构表示,其中子 Span 指示执行发生在较大的父 Span 内。
¥In each trace, one or more spans. Each span represents the length of time that one stage of the operation takes, such as serialization, or a database query. Spans are represented in a tree structure, where child spans indicate that execution is happening within a larger parent span.
跟踪中跨度的数量和类型取决于跟踪涵盖的操作类型,但示例如下:
¥The number and type of spans in a trace depends on the type of operation the trace covers, but an example is as follows:

你可以 将跟踪输出发送到控制台,或在任何 OpenTelemetry 兼容的跟踪系统中对其进行分析,例如 耶格、Honeycomb 和 数据狗。在此页面上,我们给出了如何将跟踪输出发送到 Jaeger 的示例,你可以 本地运行。
¥You can send tracing output to the console, or analyze it in any OpenTelemetry-compatible tracing system, such as Jaeger, Honeycomb and Datadog. On this page, we give an example of how to send tracing output to Jaeger, which you can run locally.
跟踪输出
¥Trace output
对于每个跟踪,Prisma 客户端都会输出一系列范围。这些跨度的数量和类型取决于 Prisma 客户端操作。典型的 Prisma 迹线具有以下跨度:
¥For each trace, Prisma Client outputs a series of spans. The number and type of these spans depends on the Prisma Client operation. A typical Prisma trace has the following spans:
-
prisma:client:operation:代表整个 Prisma Client 操作,从 Prisma Client 到数据库并返回。它包含 Prisma Client 调用的模型和方法等详细信息。根据 Prisma 操作,它包含以下一个或多个跨度:¥
prisma:client:operation: Represents the entire Prisma Client operation, from Prisma Client to the database and back. It contains details such as the model and method called by Prisma Client. Depending on the Prisma operation, it contains one or more of the following spans:-
prisma:client:connect:表示 Prisma Client 连接数据库所需的时间。¥
prisma:client:connect: Represents how long it takes for Prisma Client to connect to the database. -
prisma:client:serialize:表示验证 Prisma 客户端操作并将其转换为 查询引擎 查询所需的时间。¥
prisma:client:serialize: Represents how long it takes to validate and transform a Prisma Client operation into a query for the query engine. -
prisma:engine:query:表示查询在查询引擎中花费的时间。¥
prisma:engine:query: Represents how long a query takes in the query engine.-
prisma:engine:connection:表示 Prisma Client 获得数据库连接所需的时间。¥
prisma:engine:connection: Represents how long it takes for Prisma Client to get a database connection. -
prisma:engine:db_query:表示针对数据库执行的数据库查询。它包括标签中的查询以及查询运行所需的时间。¥
prisma:engine:db_query: Represents the database query that was executed against the database. It includes the query in the tags, and how long the query took to run. -
prisma:engine:serialize:表示将数据库的原始响应转换为类型化结果所需的时间。¥
prisma:engine:serialize: Represents how long it takes to transform a raw response from the database into a typed result. -
prisma:engine:response_json_serialization:表示将数据库查询结果序列化为对 Prisma 客户端的 JSON 响应所需的时间。¥
prisma:engine:response_json_serialization: Represents how long it takes to serialize the database query result into a JSON response to the Prisma Client.
-
-
例如,给出以下 Prisma 客户端代码:
¥For example, given the following Prisma Client code:
prisma.user.findMany({
  where: {
    email: email,
  },
  include: {
    posts: true,
  },
})
跟踪结构如下:
¥The trace is structured as follows:
-
prisma:client:operation-
prisma:client:serialize -
prisma:engine:query-
prisma:engine:connection -
prisma:engine:db_query:第一个 SQL 查询或命令的详细信息...¥
prisma:engine:db_query: details of the first SQL query or command... -
prisma:engine:db_query:...下一个 SQL 查询或命令的详细信息...¥
prisma:engine:db_query: ...details of the next SQL query or command... -
prisma:engine:serialize -
prisma:engine:response_json_serialization
-
-
注意事项和先决条件
¥Considerations and prerequisites
如果你的应用向 collector 发送大量跨度,这可能会对性能产生重大影响。有关如何最大限度地减少这种影响的信息,请参阅 减少性能影响。
¥If your application sends a large number of spans to a collector, this can have a significant performance impact. For information on how to minimize this impact, see Reducing performance impact.
要使用跟踪,你必须执行以下操作:
¥To use tracing, you must do the following:
开始在 Prisma ORM 中进行跟踪
¥Get started with tracing in Prisma ORM
本节介绍如何在应用中安装和注册跟踪。
¥This section explains how to install and register tracing in your application.
步骤 1。安装最新的 Prisma ORM 依赖
¥Step 1. Install up-to-date Prisma ORM dependencies
使用 prisma、@prisma/client 和 @prisma/instrumentation npm 包的 6.1.0 或更高版本。你还需要安装 @opentelemetry/api 包,因为它是同级依赖。
¥Use version 6.1.0 or later of the prisma, @prisma/client, and @prisma/instrumentation npm packages. You will also need to install the @opentelemetry/api package as it's a peer dependency.
npm install prisma@latest --save-dev
npm install @prisma/client@latest --save
npm install @prisma/instrumentation@latest --save
npm install @opentelemetry/api@latest --save
Tracing on previous versions of Prisma ORM
跟踪是作为预览功能添加到 Prisma ORM 的 4.2.0 版本中的。对于 4.2.0 和 6.1.0 之间的 Prisma ORM 版本,你需要在 Prisma 架构文件中启用 tracing 预览功能。
¥Tracing was added in version 4.2.0 of Prisma ORM as a Preview feature. For versions of Prisma ORM between 4.2.0 and 6.1.0, you need to enable the tracing Preview feature in your Prisma schema file.
generator client {
  provider        = "prisma-client"
  output          = "./generated"
  previewFeatures = ["tracing"]
}
第 2 步:安装 OpenTelemetry 包
¥Step 2: Install OpenTelemetry packages
现在安装适当的 OpenTelemetry 包,如下所示:
¥Now install the appropriate OpenTelemetry packages, as follows:
npm install @opentelemetry/semantic-conventions @opentelemetry/exporter-trace-otlp-http @opentelemetry/sdk-trace-base @opentelemetry/sdk-trace-node @opentelemetry/resources
步骤 3:在你的应用中注册跟踪
¥Step 3: Register tracing in your application
以下代码提供了在 Prisma 中配置 OpenTelemetry 跟踪的两个示例:
¥The following code provides two examples of configuring OpenTelemetry tracing in Prisma:
-
使用
@opentelemetry/sdk-trace-node(现有示例),可对跟踪设置进行细粒度控制。¥Using
@opentelemetry/sdk-trace-node(existing example), which gives fine-grained control over tracing setup. -
使用
@opentelemetry/sdk-node,它提供了更简单的配置并与 OpenTelemetry 的 JavaScript 入门指南保持一致。¥Using
@opentelemetry/sdk-node, which offers a simpler configuration and aligns with OpenTelemetry's JavaScript getting started guide.
选项 1:使用 @opentelemetry/sdk-trace-node
¥Option 1: Using @opentelemetry/sdk-trace-node
此设置可让你对检测和跟踪进行细粒度控制。你需要针对你的特定应用自定义此配置。对于需要快速设置以将跟踪发送到 OTLP 兼容后端(例如 Honeycomb、Jaeger 或 Datadog)的用户来说,这种方法简洁且更容易。
¥This setup gives you fine-grained control over instrumentation and tracing. You need to customize this configuration for your specific application. This approach is concise and easier for users who need a quick setup for sending traces to OTLP-compatible backends, such as Honeycomb, Jaeger, or Datadog.
// Imports
import { ATTR_SERVICE_NAME, ATTR_SERVICE_VERSION } from '@opentelemetry/semantic-conventions'
import { OTLPTraceExporter } from '@opentelemetry/exporter-trace-otlp-http'
import { SimpleSpanProcessor } from '@opentelemetry/sdk-trace-base'
import { NodeTracerProvider } from '@opentelemetry/sdk-trace-node'
import { PrismaInstrumentation, registerInstrumentations } from '@prisma/instrumentation'
import { resourceFromAttributes } from '@opentelemetry/resources'

// Configure the trace provider
const provider = new NodeTracerProvider({
  resource: resourceFromAttributes({
    [ATTR_SERVICE_NAME]: 'example application', // Replace with your service name
    [ATTR_SERVICE_VERSION]: '0.0.1', // Replace with your service version
  }),
  spanProcessors: [
    // Configure how spans are processed and exported. In this case, we're sending spans
    // as we receive them to an OTLP-compatible collector (e.g., Jaeger).
    new SimpleSpanProcessor(new OTLPTraceExporter()),
  ],
});

// Register your auto-instrumentors
registerInstrumentations({
  tracerProvider: provider,
  instrumentations: [new PrismaInstrumentation()],
})

// Register the provider globally
provider.register()
这种方法提供了最大的灵活性,但可能涉及额外的配置步骤。
¥This approach provides maximum flexibility but may involve additional configuration steps.
选项 2:使用 @opentelemetry/sdk-node
¥Option 2: Using @opentelemetry/sdk-node
对于许多用户,尤其是初学者,NodeSDK 类通过将常用默认值打包到单个统一配置中来简化 OpenTelemetry 设置。
¥For many users, especially beginners, the NodeSDK class simplifies OpenTelemetry setup by bundling common defaults into a single, unified configuration.
// Imports
import { OTLPTraceExporter } from '@opentelemetry/exporter-trace-otlp-proto'
import { NodeSDK } from '@opentelemetry/sdk-node'
import { PrismaInstrumentation } from '@prisma/instrumentation'

// Configure the OTLP trace exporter
const traceExporter = new OTLPTraceExporter({
  url: 'https://api.honeycomb.io/v1/traces', // Replace with your collector's endpoint
  headers: {
    'x-honeycomb-team': 'HONEYCOMB_API_KEY', // Replace with your Honeycomb API key or collector auth header
  },
})

// Initialize the NodeSDK
const sdk = new NodeSDK({
  serviceName: 'my-service-name', // Replace with your service name
  traceExporter,
  instrumentations: [
    new PrismaInstrumentation(),
  ],
})

// Start the SDK
sdk.start()

// Handle graceful shutdown
process.on('SIGTERM', async () => {
  try {
    await sdk.shutdown()
    console.log('Tracing shut down successfully')
  } catch (err) {
    console.error('Error shutting down tracing', err)
  } finally {
    process.exit(0)
  }
})
如果符合以下条件,请选择 NodeSDK 方法:
¥Choose the NodeSDK approach if:
-
你正在从 OpenTelemetry 开始,并且想要一个简化的设置。
¥You are starting with OpenTelemetry and want a simplified setup.
-
你需要使用最少的样板快速集成跟踪。
¥You need to quickly integrate tracing with minimal boilerplate.
-
你正在使用与 OTLP 兼容的跟踪后端,如 Honeycomb、Jaeger 或 Datadog。
¥You are using an OTLP-compatible tracing backend like Honeycomb, Jaeger, or Datadog.
如果符合以下条件,请选择 NodeTracerProvider 方法:
¥Choose the NodeTracerProvider approach if:
-
你需要详细控制如何创建、处理和导出跨度。
¥You need detailed control over how spans are created, processed, and exported.
-
你正在使用自定义跨度处理器或导出器。
¥You are using custom span processors or exporters.
-
你的应用需要特定的检测或采样策略。
¥Your application requires specific instrumentation or sampling strategies.
OpenTelemetry 具有高度可配置性。你可以自定义资源属性、检测哪些组件、如何处理跨度以及将跨度发送到何处。
¥OpenTelemetry is highly configurable. You can customize the resource attributes, what components gets instrumented, how spans are processed, and where spans are sent.
你可以在 这个示例应用 中找到包含指标的完整示例。
¥You can find a complete example that includes metrics in this sample application.
追踪方法
¥Tracing how-tos
使用 Jaeger 可视化痕迹
¥Visualize traces with Jaeger
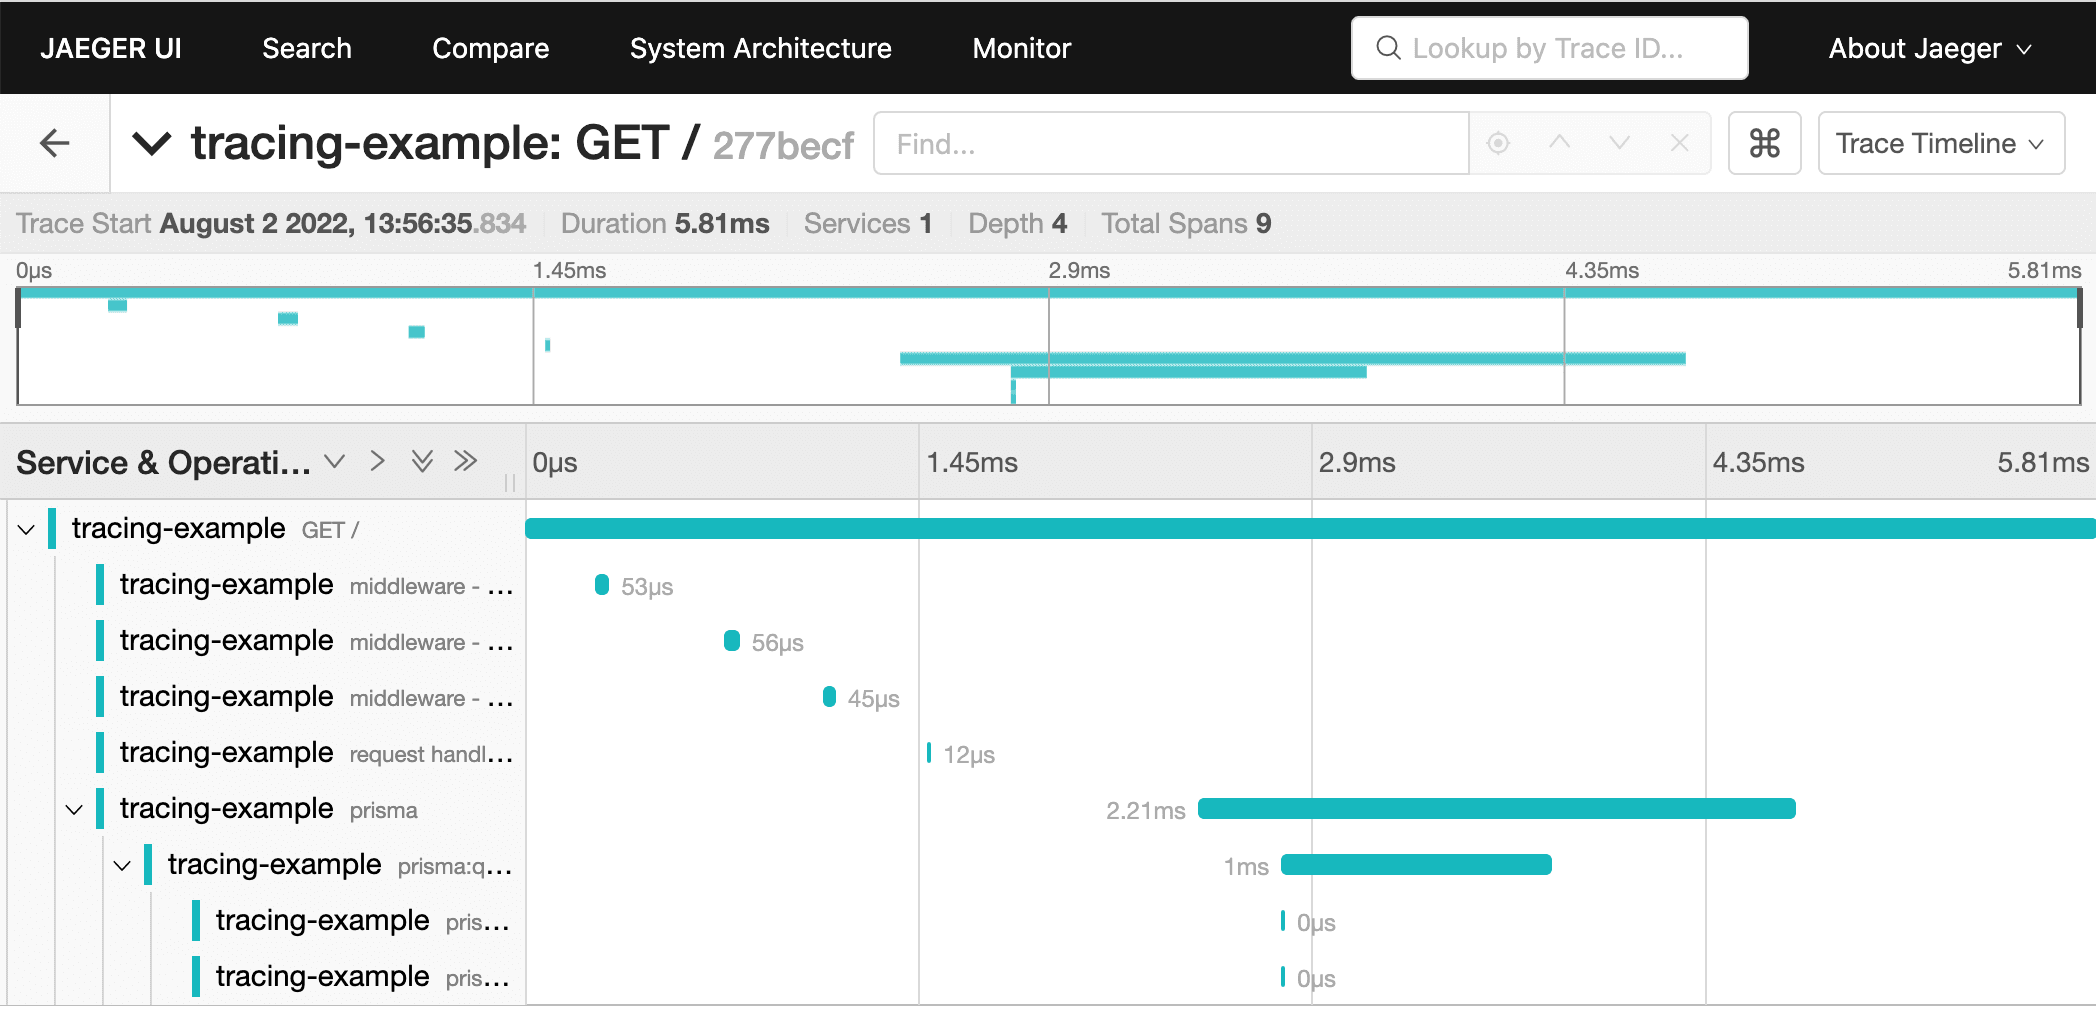
耶格 是一个免费开源的 OpenTelemetry 收集器和仪表板,你可以使用它来可视化你的跟踪。
¥Jaeger is a free and open source OpenTelemetry collector and dashboard that you can use to visualize your traces.
以下屏幕截图显示了跟踪可视化示例:
¥The following screenshot shows an example trace visualization:
要在本地运行 Jaeger,请使用以下 Docker 命令:
¥To run Jaeger locally, use the following Docker command:
docker run --rm --name jaeger -d -e COLLECTOR_OTLP_ENABLED=true -p 16686:16686 -p 4318:4318 jaegertracing/all-in-one:latest
现在,你将在 http://localhost:16686/ 找到可用的跟踪仪表板。当你在启用跟踪的情况下使用应用时,你将开始在此仪表板中看到跟踪。
¥You'll now find the tracing dashboard available at http://localhost:16686/. When you use your application with tracing enabled, you'll start to see traces in this dashboard.
将跟踪输出发送到控制台
¥Send tracing output to the console
以下示例使用 ConsoleSpanExporter 从 @opentelemetry/sdk-trace-base 将输出跟踪发送到控制台。
¥The following example sends output tracing to the console with ConsoleSpanExporter from @opentelemetry/sdk-trace-base.
// Imports
import { ATTR_SERVICE_NAME, ATTR_SERVICE_VERSION } from '@opentelemetry/semantic-conventions';
import { ConsoleSpanExporter, SimpleSpanProcessor } from '@opentelemetry/sdk-trace-base';
import { NodeTracerProvider } from '@opentelemetry/sdk-trace-node';
import { AsyncHooksContextManager } from '@opentelemetry/context-async-hooks';
import * as api from '@opentelemetry/api';
import {
  PrismaInstrumentation,
  registerInstrumentations,
} from '@prisma/instrumentation';
import { resourceFromAttributes } from '@opentelemetry/resources';

// Export the tracing
export function otelSetup() {
  const contextManager = new AsyncHooksContextManager().enable();

  api.context.setGlobalContextManager(contextManager);

  //Configure the console exporter
  const consoleExporter = new ConsoleSpanExporter();

  // Configure the trace provider
  const provider = new NodeTracerProvider({
    resource: resourceFromAttributes({
      [ATTR_SERVICE_NAME]: 'example application', // Replace with your service name
      [ATTR_SERVICE_VERSION]: '0.0.1', // Replace with your service version
    }),
    spanProcessors: [
      // Configure how spans are processed and exported. In this case, we're sending spans
      // as we receive them to the console
      new SimpleSpanProcessor(consoleExporter),
    ],
  });

  // Register your auto-instrumentors
  registerInstrumentations({
    tracerProvider: provider,
    instrumentations: [new PrismaInstrumentation()],
  });

  // Register the provider
  provider.register();
}
追踪互动事务
¥Trace interactive transactions
当你执行交互式事务时,除了 标准跨度 之外,你还会看到以下跨度:
¥When you perform an interactive transaction, you'll see the following spans in addition to the standard spans:
-
prisma:client:transaction:封装prisma跨度的 根跨度。¥
prisma:client:transaction: A root span that wraps theprismaspan.-
prisma:engine:itx_runner:表示交互事务在 查询引擎 中花费的时间。¥
prisma:engine:itx_runner: Represents how long an interactive transaction takes in the query engine. -
prisma:engine:itx_query_builder:表示构建一个交互式事务所需的时间。¥
prisma:engine:itx_query_builder: Represents the time it takes to build an interactive transaction.
-
以以下 Prisma 架构为例:
¥As an example, take the following Prisma schema:
generator client {
  provider        = "prisma-client"
  output          = "./generated"
}

datasource db {
  provider = "postgresql"
}

model User {
  id    Int    @id @default(autoincrement())
  email String @unique
}

model Audit {
  id     Int    @id
  table  String
  action String
}
给定以下交互事务:
¥Given the following interactive transaction:
await prisma.$transaction(async (tx) => {
  const user = await tx.user.create({
    data: {
      email: email,
    },
  })

  await tx.audit.create({
    data: {
      table: 'user',
      action: 'create',
      id: user.id,
    },
  })

  return user
})
跟踪结构如下:
¥The trace is structured as follows:
-
prisma:client:transaction -
prisma:client:connect -
prisma:engine:itx_runner-
prisma:engine:connection -
prisma:engine:db_query -
prisma:engine:itx_query_builder-
prisma:engine:db_query -
prisma:engine:db_query -
prisma:engine:serialize
-
-
prisma:engine:itx_query_builder-
prisma:engine:db_query -
prisma:engine:db_query -
prisma:engine:serialize
-
-
-
prisma:client:operationprisma:client:serialize
-
prisma:client:operationprisma:client:serialize
添加更多仪器
¥Add more instrumentation
OpenTelemetry 的一个很好的好处是能够添加更多的仪器,而只需对应用代码进行最小的更改。
¥A nice benefit of OpenTelemetry is the ability to add more instrumentation with only minimal changes to your application code.
例如,要添加 HTTP 和 ExpressJS 跟踪,请将以下检测添加到 OpenTelemetry 配置中。这些工具增加了整个请求-响应生命周期的跨度。这些跨度显示你的 HTTP 请求需要多长时间。
¥For example, to add HTTP and ExpressJS tracing, add the following instrumentations to your OpenTelemetry configuration. These instrumentations add spans for the full request-response lifecycle. These spans show you how long your HTTP requests take.
// Imports
import { ExpressInstrumentation } from '@opentelemetry/instrumentation-express'
import { HttpInstrumentation } from '@opentelemetry/instrumentation-http'

// Register your auto-instrumentors
registerInstrumentations({
  tracerProvider: provider,
  instrumentations: [
    new HttpInstrumentation(),
    new ExpressInstrumentation(),
    new PrismaInstrumentation(),
  ],
})
有关可用仪器的完整列表,请查看 开放遥测注册表。
¥For a full list of available instrumentation, take a look at the OpenTelemetry Registry.
自定义资源属性
¥Customize resource attributes
你可以通过更改资源属性来调整应用跟踪的分组方式,使其更适合你的应用:
¥You can adjust how your application's traces are grouped by changing the resource attributes to be more specific to your application:
const provider = new NodeTracerProvider({
  resource: new Resource({
    [ATTR_SERVICE_NAME]: 'weblog',
    [ATTR_SERVICE_VERSION]: '1.0.0',
  }),
})
人们正在努力标准化公共资源属性。只要有可能,最好遵循 标准属性名称。
¥There is an ongoing effort to standardize common resource attributes. Whenever possible, it's a good idea to follow the standard attribute names.
减少性能影响
¥Reduce performance impact
如果你的应用向收集器发送大量跨度,这可能会对性能产生重大影响。你可以使用以下方法来减少这种影响:
¥If your application sends a large number of spans to a collector, this can have a significant performance impact. You can use the following approaches to reduce this impact:
使用 BatchSpanProcessor 批量发送轨迹
¥Send traces in batches using the BatchSpanProcessor
在生产环境中,你可以使用 OpenTelemetry 的 BatchSpanProcessor 将跨度批量发送到收集器,而不是一次发送一个。但是,在开发和测试期间,你可能不希望批量发送跨度。在这种情况下,你可能更愿意使用 SimpleSpanProcessor。
¥In a production environment, you can use OpenTelemetry's BatchSpanProcessor to send the spans to a collector in batches rather than one at a time. However, during development and testing, you might not want to send spans in batches. In this situation, you might prefer to use the SimpleSpanProcessor.
你可以根据环境将跟踪配置配置为使用适当的跨度处理器,如下所示:
¥You can configure your tracing configuration to use the appropriate span processor, depending on the environment, as follows:
import {
  SimpleSpanProcessor,
  BatchSpanProcessor,
} from '@opentelemetry/sdk-trace-base';
import { NodeTracerProvider } from '@opentelemetry/sdk-trace-node';

const spanProcessors = [];
if (process.env.NODE_ENV === 'production') {
  spanProcessors.push(new BatchSpanProcessor(otlpTraceExporter));
} else {
  spanProcessors.push(new SimpleSpanProcessor(otlpTraceExporter));
}

const provider = new NodeTracerProvider({
  spanProcessors,
  // ...other configurations
});
通过采样向收集器发送更少的跨度
¥Send fewer spans to the collector with sampling
减少性能影响的另一种方法是 使用概率抽样 向收集器发送更少的跨度。这降低了跟踪的收集成本,但仍然可以很好地表示应用中发生的情况。
¥Another way to reduce the performance impact is to use probability sampling to send fewer spans to the collector. This reduces the collection cost of tracing but still gives a good representation of what is happening in your application.
示例实现如下所示:
¥An example implementation looks like this:
import { ATTR_SERVICE_NAME, ATTR_SERVICE_VERSION } from '@opentelemetry/semantic-conventions';
import { NodeTracerProvider } from '@opentelemetry/sdk-trace-node';
import { TraceIdRatioBasedSampler } from '@opentelemetry/core';
import { resourceFromAttributes } from '@opentelemetry/resources';

const provider = new NodeTracerProvider({
  sampler: new TraceIdRatioBasedSampler(0.1),
  resource: resourceFromAttributes({
    // we can define some metadata about the trace resource
    [ATTR_SERVICE_NAME]: 'test-tracing-service',
    [ATTR_SERVICE_VERSION]: '1.0.0',
  }),
});
追踪疑难解答
¥Troubleshoot tracing
我的踪迹没有显现
¥My traces aren't showing up
设置跟踪的顺序很重要。在你的应用中,确保在导入任何已检测的依赖之前注册跟踪和检测。例如:
¥The order in which you set up tracing matters. In your application, ensure that you register tracing and instrumentation before you import any instrumented dependencies. For example:
import { registerTracing } from './tracing'

registerTracing({
  name: 'tracing-example',
  version: '0.0.1',
})

// You must import any dependencies after you register tracing.
import { PrismaClient } from '../prisma/generated/client'
import async from 'express-async-handler'
import express from 'express'